Dec 13, 2016
- Provide an appropriate response.
- 1. The two most frequently used measures of central tendency are the mean and the median. Compare these two measures for the following characteristics: Takes every score into account? Affected by extreme scores? Advantages.
Possible answer - 2. F company advertises an average of 42,000 miles for one of its new tires. In the manufacturing process, there is some variation around that average. Would the company want a process that provides a large or a small variance? Justify your answer.
Possible answer - 3. The textbook defines unusual values as those data points with z scores less than z= –2.00 or z-scores greater than z = 2.00. Comment on this definition with respect to “Chebyshev’s Theorem”; refer specifically to the percent of scores which would be defined as unusual according to “Chebyshev’s Theorem”.
Possible answer
- 1. The two most frequently used measures of central tendency are the mean and the median. Compare these two measures for the following characteristics: Takes every score into account? Affected by extreme scores? Advantages.
- Find the mean for the given sample data.
- 4. Frank’s Furniture employees earned the following amounts last week:
$375.51 $339.04 $180.97 $421.73 $516.56 $370.13 $466.92 $165.25 $457.10
What was the mean amount earned by an employee last week? Round your answer to the nearest cent.- $411.65
- $365.91
- $359.25
- $470.46
- 4. Frank’s Furniture employees earned the following amounts last week:
- Find the median for the given sample data.
- 5. The number of vehicles passing through a bank drive-up line during each 15-minute period was recorded. The results are shown below. Find the median number of vehicles going through the line in a fifteen-minute period.
28 30 28 31
31 28 33 30
38 34 34 32
27 34 28 23
18 30 30 30- 31
- 29.85
- 34
- 30
- 5. The number of vehicles passing through a bank drive-up line during each 15-minute period was recorded. The results are shown below. Find the median number of vehicles going through the line in a fifteen-minute period.
- Find the mode(s) for the given sample data.
- 6. The speeds (in mph) of the cars passing a certain checkpoint are measured by radar. The results are shown below.
40.4 42.1 42.3 43.2 44.1
44.1 42.1 40.9 43.4 43.2
40.4 40.9 43.2 42.4 42.1
42.2 42.2 42.3 40.7 40.4- 41.90
- 42.1
- 40.4, 43.2, 42.1
- 40.4
- 6. The speeds (in mph) of the cars passing a certain checkpoint are measured by radar. The results are shown below.
- Find the midrange for the given sample data.
- 7. The speeds (in mph) of the cars passing a certain checkpoint are measured by radar. The results are shown below. Find the midrange.
44.4 41.7 43.0 40.7 43.0
40.3 44.8 42.0 44.4 42.8
43.1 42.0 40.7 43.1 41.7- 42.55
- 4.50
- 42.35
- 42.8
- 8. A company had 80 employees whose salaries are summarized in the frequency distribution below. Find the mean salary.
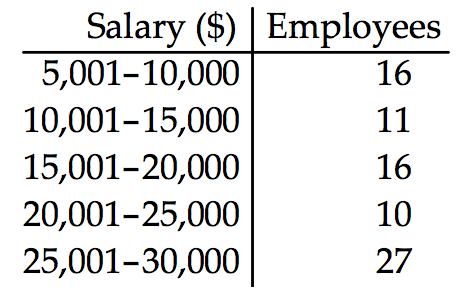
- $17,500
- $18,813.00
- $16,931.70
- $20,694.30
- 7. The speeds (in mph) of the cars passing a certain checkpoint are measured by radar. The results are shown below. Find the midrange.
- Solve the problem.
- 9. Carl gets quiz grades of 70, 75, 82, and 85. He gets a 94 on his final exam. Find the weighted mean if the quizzes each count for 10% and the final exam counts for 60% of the final grade.
- 85.3
- 87.6
- 86.7
- 88.0
- 10. The 10% trimmed mean of a data set is found by arranging the data in order, deleting the bottom 10% of the values and the top 10% of the values and then calculation the mean of the remaining values. What advantages do you think that the trimmed mean has as compared to the mean?
Possible answer
- 9. Carl gets quiz grades of 70, 75, 82, and 85. He gets a 94 on his final exam. Find the weighted mean if the quizzes each count for 10% and the final exam counts for 60% of the final grade.
- Find the range for the given data.
- 11. A class of sixth grade student kept accurate records on the amount of time they spent playing video games during a one-week period. The times (in hours) are listed below.
23.0 15.5 9.6 24.4 15.2
30.5 24.1 16.6 15.7 14.0
Compute the range.- 9.6
- 20.9
- 15.2
- 7.5
- 12. Find the variance for these data. Round your answer to one more decimal place than the original data.
4, 11, 11, 2, and 8- 27.5
- 16.6
- 16.7
- 13.4
- 11. A class of sixth grade student kept accurate records on the amount of time they spent playing video games during a one-week period. The times (in hours) are listed below.
- Solve the problem.
- 13. The race speeds for the top eight cars in a 200-mile race are listed below. Use the range rule of thumb to find the standard deviation. Round results to the nearest tenth.
- 7.5
- 1.1
- 3.4
- 6.8
- 14. The maximum value of a distribution is 36.3 and the minimum value is 3.3. Use the range rule of thumb to find the standard deviation. Round results to the nearest tenth.
- 14.9
- 5.3
- 13.3
- 8.3
- 13. The race speeds for the top eight cars in a 200-mile race are listed below. Use the range rule of thumb to find the standard deviation. Round results to the nearest tenth.
- Use the empirical rule to solve the problem.
- 15. The systolic blood pressure of 18-year-old women is normally distributed with a man of 120 mmHg and a standard deviation of 12 mmHg. What percentage of 18-year-old women have a systolic blood pressure between 96 mmHg and 144 mmHg?
- 95.44%
- 68.26%
- 99.99%
- 99.74%
- 15. The systolic blood pressure of 18-year-old women is normally distributed with a man of 120 mmHg and a standard deviation of 12 mmHg. What percentage of 18-year-old women have a systolic blood pressure between 96 mmHg and 144 mmHg?
- Find the z-score corresponding to the given value and use the z-score to determine whether the value is unusual. Consider a score to be unusual if its z-score is less than –2.00 or greater than 2.00. Round the z-score to the nearest tenth if necessary.
- 16. A weight of 225 pounds among a population having a mean weight of 161 pounds and a standard deviation of 23.0 pounds.
- –2.8; not unusual
- 2.8; unusual
- 64.4; unusual
- 2.8; not unusual
- 16. A weight of 225 pounds among a population having a mean weight of 161 pounds and a standard deviation of 23.0 pounds.
- Determine which score corresponds to the higher relative position.
- 17. Which score has the higher relative position: a score of 55 on a test for which x̅ = 43 and s = 10, a score of 5.0 on a test for which x̅ = 4 and s = 0.8 or a score of 435.6 on a test for which x̅ = 396 and s = 44?
- A score of 55
- A score of 435.6
- A score of 5.0
- 17. Which score has the higher relative position: a score of 55 on a test for which x̅ = 43 and s = 10, a score of 5.0 on a test for which x̅ = 4 and s = 0.8 or a score of 435.6 on a test for which x̅ = 396 and s = 44?
- Find the percentile for the data point.
- 18. Data set:
10 15 35 20 10 25 50 45 55 15 15 50 30 5 50;
data point 35.- 52
- 35
- 70
- 60
- 18. Data set:
- Provide an appropriate response.
- 19. For data which are heavily skewed to the right, P10 is likely to be closer to the median than P90. True or false?
- True
- False
- 19. For data which are heavily skewed to the right, P10 is likely to be closer to the median than P90. True or false?
- Construct a boxplot for the given data. Include values of the 5-number summary in all boxplots.
- 20. The ages of the 35 members of a track and field team are listed below. Construct a boxplot for the data set.
15 16 18 18 18 19 20
20 20 21 21 22 22 23
23 24 24 24 25 25 26
27 27 28 29 29 30 31
31 33 34 35 39 42 48
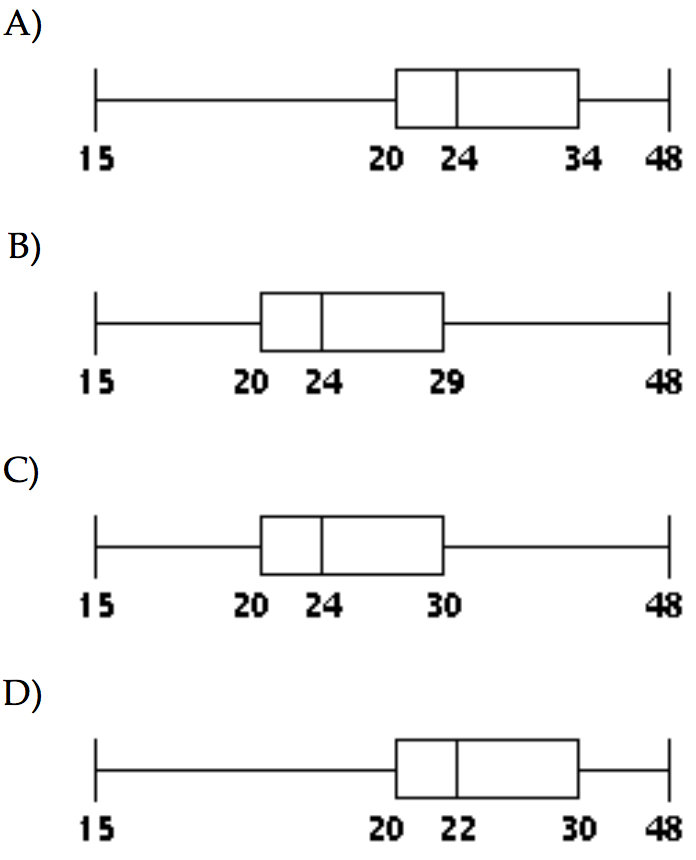
- the boxplot A
- the boxplot B
- the boxplot C
- the boxplot D
- 20. The ages of the 35 members of a track and field team are listed below. Construct a boxplot for the data set.
© 2020 DrillPal.com