May 9, 2017
- Provide an appropriate response.
- 1. What is the effect on the P-value when a test is changed from a two-tailed hypothesis with = and ≠ to a one-tailed hypothesis such as ≥ and
Possible answer
- 1. What is the effect on the P-value when a test is changed from a two-tailed hypothesis with = and ≠ to a one-tailed hypothesis such as ≥ and
- Find the number of successes x suggested by the given statement.
- 2. Among 1410 randomly selected car drivers in one city, 7.52% said that they had been involved in an accident during the past year.
- 105
- 106
- 104
- 107
- 2. Among 1410 randomly selected car drivers in one city, 7.52% said that they had been involved in an accident during the past year.
- From the sample statistics, find the value of p-bar used to test the hypothesis that the population proportions are equal.
- 3. n1 = 100, x1 = 34; n2 = 100, x2 = 30
- 0.288
- 0.224
- 0.320
- 0.352
- 3. n1 = 100, x1 = 34; n2 = 100, x2 = 30
- Compute the test statistic used to test the null hypothesis that p1 = p2.
- 4. A report on the nightly news broadcast stated that 15 out of 140 households with pet dogs were burglarized and 20 out of 180 without pet dogs were burglarized.
- 0.000
- –0.192
- –0.045
- –0.113
- 4. A report on the nightly news broadcast stated that 15 out of 140 households with pet dogs were burglarized and 20 out of 180 without pet dogs were burglarized.
- Find the appropriate p-value to test the null hypothesis, H0: p1 = p2, using a significance level of 0.05.
- 5. n1 = 50, x1 = 20; n2 = 75, x2 = 15
- .0032
- .1201
- .0146
- .0001
- 5. n1 = 50, x1 = 20; n2 = 75, x2 = 15
- Use the traditional method to test the given hypothesis. Assume that the samples are independent and that they have been randomly selected.
- 6. Use the given sample data to test the claim p1 > p2. Use a significance level of 0.01.
Sample 1: n1 = 85, x1 = 38
Sample 2: n2 = 90, x2 = 23
Possible answer - 7. A researcher finds that of 1,000 people who said that they attend a religious service at least once a week, 31 stopped to help a person with car trouble. Of 1,200 people interviewed who had not attended a religious service at least once a month, 22 stopped to help a person with car trouble. At the 0.05 significance level, test the claim that the two proportions are equal.
Possible answer
- 6. Use the given sample data to test the claim p1 > p2. Use a significance level of 0.01.
- Construct the indicated confidence interval for the difference between population proportions p1 — p2. Assume that the samples are independent and that they have been randomly selected.
- 8. x1 = 10, n1 = 42 and x2 = 27, n2 = 47. Construct a 90% confidence interval for the difference between population proportions p1 — p2.
- 0.076 < p1 – p2 < 0.400
- 0.047 < p1 – p2 < 0.429
- –0.497 < p1 – p2 < –0.176
- 0.429 < p1 – p2 < 0.045
- 8. x1 = 10, n1 = 42 and x2 = 27, n2 = 47. Construct a 90% confidence interval for the difference between population proportions p1 — p2.
- Determine whether the samples are independent or consist of matched pair.
- 9. The accuracy of verbal responses is tested in an experiment in which individuals report their heights and then are measured. The data consist of the reported height and measured height for each individual.
- Independent samples
- Matched pairs
- 9. The accuracy of verbal responses is tested in an experiment in which individuals report their heights and then are measured. The data consist of the reported height and measured height for each individual.
- Test the indicated claim about the means of two populations. Assume that the two samples are independent and that they have been randomly selected.
- 10. Two types of flares are tested for their burning times (in minutes) and sample results are given below:
Brand X: n = 35, x̅ = 19.4, s = 1.4;
Brand Y: n = 40, x̅ = 15.1, s = 0.8.
Refer to the sample date to test the claim that the two populations have equal means. Use a 0.05 significance level.
Possible answer
- 10. Two types of flares are tested for their burning times (in minutes) and sample results are given below:
- Construct the indicated confidence interval for the difference between the two population means. Assume that the two samples are independent and that they have been randomly selected.
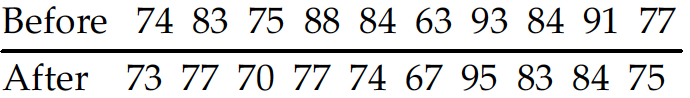
- 11. A researcher wishes to determine whether people with high blood pressure can reduce their blood pressure by following a particular diet. Use the sample data below to construct a 99% confidence interval for µ1 – µ2 where µ1 and µ2 represent the mean for the treatment group and the control group respectively.
Treatment Group: n1 = 85, x̅1 = 189.1, s1 = 38.7
Control Group: n2 = 75, x̅2 = 203.7, s2 = 39.2- –29.0 < µ1 – µ2 < –0.2
- –26.7 < µ1 – µ2 < –2.5
- –30.9 < µ1 – µ2 < 1.7
- –1.3 < µ1 – µ2 < 30.5
- 11. A researcher wishes to determine whether people with high blood pressure can reduce their blood pressure by following a particular diet. Use the sample data below to construct a 99% confidence interval for µ1 – µ2 where µ1 and µ2 represent the mean for the treatment group and the control group respectively.
- Find sd.
- 12. Consider the set of differences between two dependent sets: 84, 85, 83, 63, 61, 100, 98.
Round to the nearest tenth.- 16.2
- 15.3
- 13.1
- 15.7
- 12. Consider the set of differences between two dependent sets: 84, 85, 83, 63, 61, 100, 98.
- The two data sets are dependent. Find the mean value of the differences d for the paired sample data (d-bar) to the nearest tenth.
- 13. ***
A: 60, 61, 64, 63, 51
B: 25, 23, 29, 25, 22- 43.8
- 45.5
- 21.0
- 35.0
- 13. ***
- Determine whether the hypothesis test involves a sampling distribution of means that is a normal distribution, Student t distribution, or neither.
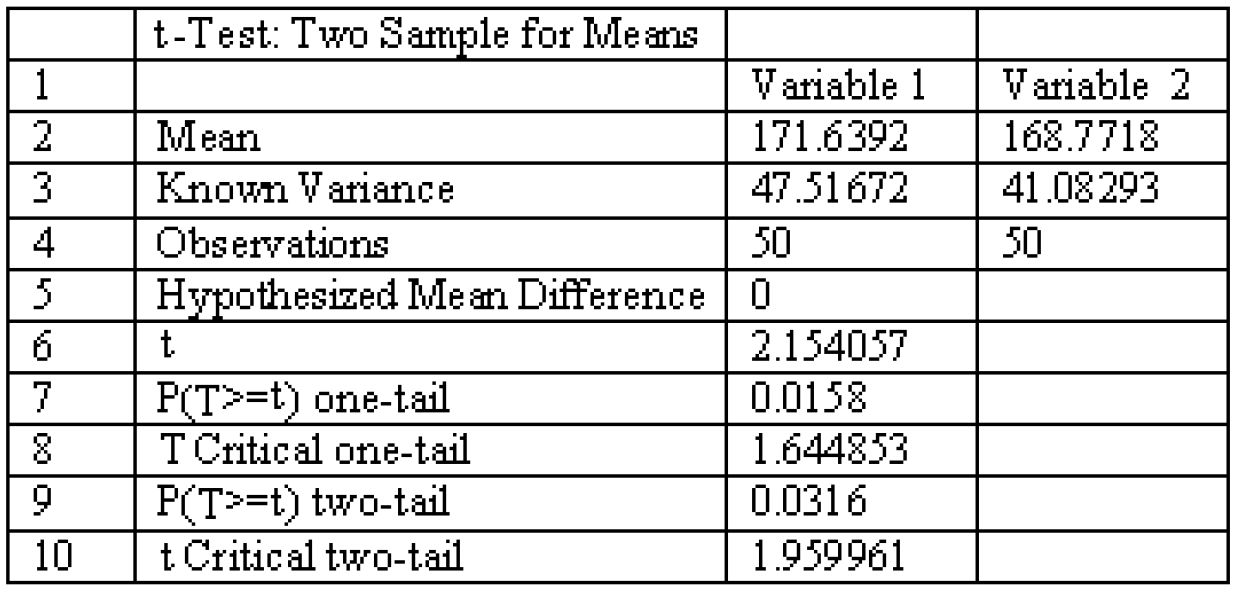
- 14. When testing for a difference between the means of a treatment group and a placebo group, the computer display below is obtained. Using a 0.04 significance level, is there sufficient evidence to support the claim that the treatment group (variable 1) comes from a population with a mean that is different from the mean for the placebo population? Explain.
Possible answer
- 14. When testing for a difference between the means of a treatment group and a placebo group, the computer display below is obtained. Using a 0.04 significance level, is there sufficient evidence to support the claim that the treatment group (variable 1) comes from a population with a mean that is different from the mean for the placebo population? Explain.
- Assume that you want to test the claim that the paired sample data come from a population for which the mean difference is µd = 0. Compute the value of the t test statistic.
- 15.
- t = –1.480
- t = 0.690
- t = –0.185
- t = –0.523
- 15.
- Determine the decision criterion for rejecting the null hypothesis in the given hypothesis test; i.e., describe the values of the test statistic that would result in rejection of the null hypothesis.
- 16. A farmer has decided to use a new additive to grow his crops. He divided his farm into 10 plots and kept records of the corn yield (in bushels) before and after using the additive. The results are shown below.
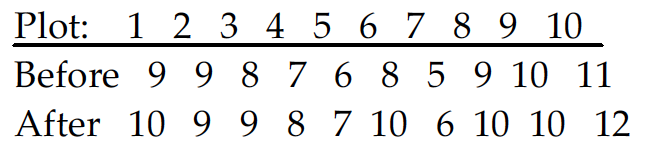
You wish the test the following hypothesis at the 5 percent level of significance.
H0: µD = 0 against H1: µD > 0.
What decision rule would you use?- Reject H0 if test statistic is less than 1.833.
- Reject H0 if test statistic is greater than –1.833 or less than 1.833.
- Reject H0 if test statistic is greater than 1.833.
- Reject H0 if test statistic is greater than –1.833.
- 16. A farmer has decided to use a new additive to grow his crops. He divided his farm into 10 plots and kept records of the corn yield (in bushels) before and after using the additive. The results are shown below.
- Use the traditional method of hypothesis testing to test the given claim about the means of two populations. Assume that two dependent samples have been randomly selected from normally distributed populations.
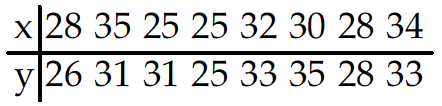
- 17. A test of abstract reasoning is given to a random sample of students before and after they completed a formal logic course. The results are given below. At the 0.05 significance level, test the claim that the mean score is not affected by the course.
Possible answer
- 17. A test of abstract reasoning is given to a random sample of students before and after they completed a formal logic course. The results are given below. At the 0.05 significance level, test the claim that the mean score is not affected by the course.
- Construct a confidence interval for µd, the mean of the differences d for the population of paired data. Assume that the population of paired differences is normally distributed.
- 18. If d-bar = 3.125, sd = 2.911 and n = 8, determine a 99 percent confidence interval for µd.
- 1.851 < µd < 4.399
- 1.851 < µd < 6.726
- –0.476 < µd < 6.726
- –0.360 < µd < 4.399
- 18. If d-bar = 3.125, sd = 2.911 and n = 8, determine a 99 percent confidence interval for µd.
- Test the indicated claim about the variances or standard deviations of two populations. Assume that the populations are normally distributed. Assume that the two samples are independent and that they have been randomly selected.
- 19. Two types of flares are tested for their burning times (in minutes) and sample results are given below. Use a 0.05 significance level to test the claim that the two brands have equal variances.
Brand X: n = 35, x̅ = 19.4, s = 1.4
Brand Y: n = 40, x̅ = 15.1, s = 0.8
Possible answer
- 19. Two types of flares are tested for their burning times (in minutes) and sample results are given below. Use a 0.05 significance level to test the claim that the two brands have equal variances.
- Solve the problem.
- 20. A test for homogeneity of variance is conducted at the 5% level of significance. Sample sizes are n1 = 31 and n2 = 31. The test statistic is F = 6.4071. What do you know about the variance of the populations from which the samples were taken?
Possible answer
- 20. A test for homogeneity of variance is conducted at the 5% level of significance. Sample sizes are n1 = 31 and n2 = 31. The test statistic is F = 6.4071. What do you know about the variance of the populations from which the samples were taken?
© 2020 DrillPal.com