Jun 7, 2017
- Provide an appropriate response.
- 1. Compare the technique for decision making about populations using the hypothesis test method and the confidence interval method.
Possible answer
- 1. Compare the technique for decision making about populations using the hypothesis test method and the confidence interval method.
- Find the number of successes x suggested by the given statement.
- 2. Among 690 adults selected randomly from among the residents of one town, 28.3% said that they favor stronger gun-control laws.
- 194
- 193
- 196
- 195
- 2. Among 690 adults selected randomly from among the residents of one town, 28.3% said that they favor stronger gun-control laws.
- From the sample statistics, find the value of p-bar used to test the hypothesis that the population proportions are equal.
- 3. n1 = 541, x1 = 160; n2 = 1927, x2 = 689
- 0.688
- 0.344
- 0.587
- 0.275
- 3. n1 = 541, x1 = 160; n2 = 1927, x2 = 689
- Compute the test statistic used to test the null hypothesis that p1 = p2.
- 4. In a vote on the Clean Water bill, 41% of the 205 Democrats voted for the bill while 42% of the 230 Republicans voted for it.
- –0.232
- –0.179
- –0.127
- –0.253
- 4. In a vote on the Clean Water bill, 41% of the 205 Democrats voted for the bill while 42% of the 230 Republicans voted for it.
- Find the appropriate p-value to test the null hypothesis, H0: p1 = p2, using a significance level of 0.05.
- 5. n1 = 100, x1 = 38; n2 = 100, x2 = 40
- .1610
- .7718
- .2130
- .0412
- 5. n1 = 100, x1 = 38; n2 = 100, x2 = 40
- Use the traditional method to test the given hypothesis. Assume that the samples are independent and that they have been randomly selected.
- 6. A marketing survey involves product recognition in New York and California. Of 558 New Yorkers surveyed, 193 knew the product while 196 out of 614 Californians knew the product. At the 0.05 significance level, test the claim that the recognition rates are the same in both states.
Possible answer - 7. 7 of 8,500 people vaccinated against a certain disease later developed the disease. 18 of 10,000 people vaccinated with a placebo later developed the disease. Test the claim that the vaccine is effective in lowering the incidence of the disease. Use a significance lever of 0.02.
Possible answer
- 6. A marketing survey involves product recognition in New York and California. Of 558 New Yorkers surveyed, 193 knew the product while 196 out of 614 Californians knew the product. At the 0.05 significance level, test the claim that the recognition rates are the same in both states.
- Construct the indicated confidence interval for the difference between population proportions p1 — p2. Assume that the samples are independent and that they have been randomly selected.
- 8. x1 = 62, n1 = 124 and x2 = 65, n2 = 125. Construct a 98% confidence interval for the difference between population proportions p1 – p2.
- 0.376 < p1 – p2 < 0.624
- –0.168 < p1 – p2 < 0.128
- 0.352 < p1 – p2 < 0.648
- –0.144 < p1 – p2 < 0.624
- 8. x1 = 62, n1 = 124 and x2 = 65, n2 = 125. Construct a 98% confidence interval for the difference between population proportions p1 – p2.
- Determine whether the samples are independent or consist of matched pair.
- 9. The effectiveness of a new headache medicine is tested by measuring the amount of time before the headache is cured for patients who use the medicine and another group of patients who use a placebo drug.
- Matched pairs
- Independent samples
- 9. The effectiveness of a new headache medicine is tested by measuring the amount of time before the headache is cured for patients who use the medicine and another group of patients who use a placebo drug.
- Test the indicated claim about the means of two populations. Assume that the two samples are independent and that they have been randomly selected.
- 10. A researcher wishes to determine whether people with high blood pressure can reduce their blood pressure by following a particular diet. Use the sample data below to test the claim that the treatment population mean µ1 is smaller than the control population mean µ2. Test the claim using a significance level of 0.01.
Treatment Group: n1 = 85, x̅1 = 189.1, s1 = 38.7;
Control Group: n2 = 75, x̅2 = 203.7, s2 = 39.2.
Possible answer
- 10. A researcher wishes to determine whether people with high blood pressure can reduce their blood pressure by following a particular diet. Use the sample data below to test the claim that the treatment population mean µ1 is smaller than the control population mean µ2. Test the claim using a significance level of 0.01.
- Construct the indicated confidence interval for the difference between the two population means. Assume that the two samples are independent and that they have been randomly selected.
- 11. Two types of flares are tested for their burning times (in minutes) and sample results are given below.
Brand X: n = 35, x̅ = 19.4, s = 1.4;
Brand Y: n = 40, x̅1 = 15.1, s = 0.8.
Construct a 95% confidence interval for the differences µX – µY based on the sample data.- 3.2 < µX – µY < 5.4
- 3.8 < µX – µY < 4.8
- 3.6 < µX – µY < 5.0
- 3.5 < µX – µY < 5.1
- 11. Two types of flares are tested for their burning times (in minutes) and sample results are given below.
- Use the computer display to solve the problem.
- 12. When testing for a difference between the means of a treatment group and a placebo group, the computer display below is obtained. Using a 0.05 significance level, is there sufficient evidence to support the claim that the treatment group (variable 1) comes from a population with a mean that is greater than the mean that is different from the mean for the placebo population? Explain.
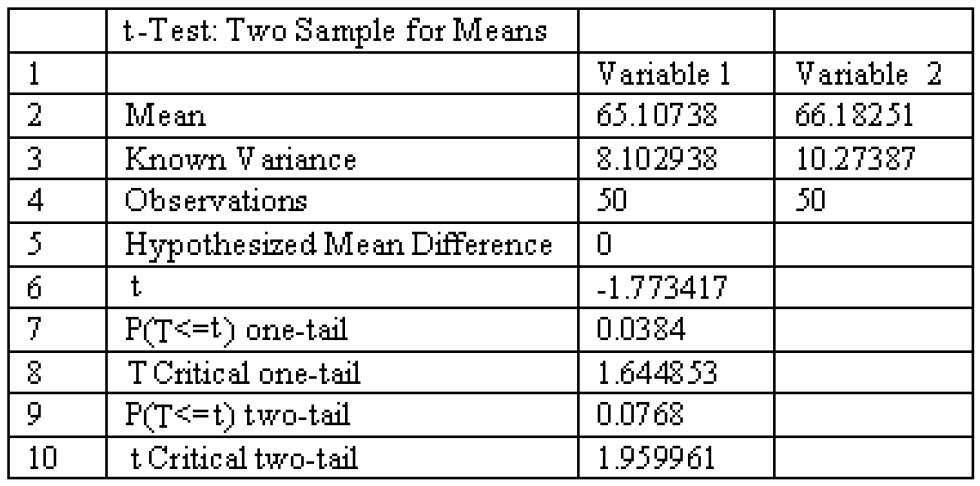
Possible answer
- 12. When testing for a difference between the means of a treatment group and a placebo group, the computer display below is obtained. Using a 0.05 significance level, is there sufficient evidence to support the claim that the treatment group (variable 1) comes from a population with a mean that is greater than the mean that is different from the mean for the placebo population? Explain.
- The two data sets are dependent. Find the mean value of the differences for the paired sample data (d-bar) to the nearest tenth.
- 13. ***
X: 8.0 7.3 7.1 5.7 6.8 5.7
Y: 9.5 7.7 8.9 9.6 8.1 9.3- –2.1
- –1.3
- –12.6
- –2.7
- 13. ***
- Find sd.
- 14. The differences between two sets of dependent data are –9, 3, –9, 6. Round to the nearest tenth.
- 181.7
- 7.9
- 6.3
- 4.0
- 14. The differences between two sets of dependent data are –9, 3, –9, 6. Round to the nearest tenth.
- Assume that you want to test the claim that the paired sample data come from a population for which the mean difference is µd = 0. Compute the value of the t test statistic.
- 15.
- t = 2.890
- t = 1.292
- t = 0.415
- t = 0.578
- 15.
- Determine the decision criterion for rejecting the null hypothesis in the given hypothesis test; i.e., describe the values of the test statistic that would result in rejection of the null hypothesis.
- 16. Suppose you wish to test the claim that µd, the mean value of the differences d for a population of paired data, is greater than 0. Given a sample of n = 15 and a significance level of α = 0.01, what criterion would be used for rejecting the null hypothesis?
- Reject null hypothesis if test statistic > 2.977 or < –2.977.
- Reject null hypothesis if test statistic < 2.624.
- Reject null hypothesis if test statistic > 2.624.
- Reject null hypothesis if test statistic > 2.602.
- 16. Suppose you wish to test the claim that µd, the mean value of the differences d for a population of paired data, is greater than 0. Given a sample of n = 15 and a significance level of α = 0.01, what criterion would be used for rejecting the null hypothesis?
- Use the traditional method of hypothesis testing to test the given claim about the means of two populations. Assume that two dependent samples have been randomly selected from normally distributed populations.
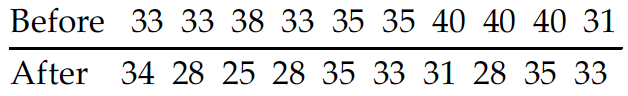
- 17. Ten different families are tested for the number of gallons of water a day they use before and after viewing a conservation video. At the 0.05 significance level, test the claim that the mean is the same before and after the viewing.
Possible answer
- 17. Ten different families are tested for the number of gallons of water a day they use before and after viewing a conservation video. At the 0.05 significance level, test the claim that the mean is the same before and after the viewing.
- Construct a confidence interval for µd, the mean of the differences d for the population of paired data. Assume that the population of paired differences is normally distributed.
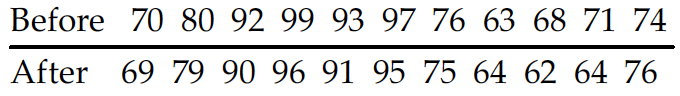
- 18. A test of writing ability is given to a random sample of student before and after they completed a formal writing course. The results are given below. Construct a 99% confidence interval for the mean difference between the before and after scores.
- –0.1 < µd < 4.1
- 1.2 < µd < 2.8
- –0.5 < µd < 4.5
- –0.2 < µd < 4.2
- 18. A test of writing ability is given to a random sample of student before and after they completed a formal writing course. The results are given below. Construct a 99% confidence interval for the mean difference between the before and after scores.
- Test the indicated claim about the variances or standard deviations of two populations. Assume that the populations are normally distributed. Assume that the two samples are independent and that they have been randomly selected.
- 19. A randomly sample of 16 women resulted in blood pressure levels with a standard deviation of 22.7 mm Hg. A random sample of 17 men resulted in blood pressure levels with a standard deviation of 20.6 mm Hg. Use a 0.025 significance level to test the claim that blood pressure levels for women have a larger variance than those for men.
Possible answer
- 19. A randomly sample of 16 women resulted in blood pressure levels with a standard deviation of 22.7 mm Hg. A random sample of 17 men resulted in blood pressure levels with a standard deviation of 20.6 mm Hg. Use a 0.025 significance level to test the claim that blood pressure levels for women have a larger variance than those for men.
- Solve the problem.
- 20. A test for homogeneity of variance is conducted at the 5% level of significance. Sample sizes are n1 = 25 and n2 = 25. The test statistic is F = 1.0052. What do you know about the variance of the populations from which the samples were taken?
Possible answer
- 20. A test for homogeneity of variance is conducted at the 5% level of significance. Sample sizes are n1 = 25 and n2 = 25. The test statistic is F = 1.0052. What do you know about the variance of the populations from which the samples were taken?
arrow_backarrow_forward
© 2020 DrillPal.com