Jan 12, 2017
- Provide an appropriate response.
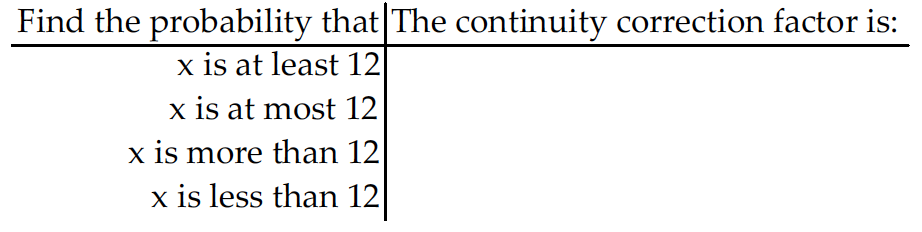
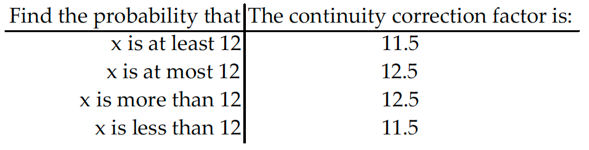
- 1. Complete the following table for a distribution in which μ = 16. It might be helpful to make a diagram to help you determine the continuity factor for each entry.
Possible answer
- 1. Complete the following table for a distribution in which μ = 16. It might be helpful to make a diagram to help you determine the continuity factor for each entry.
- Using the following uniform density curve, answer the question.
- 2.
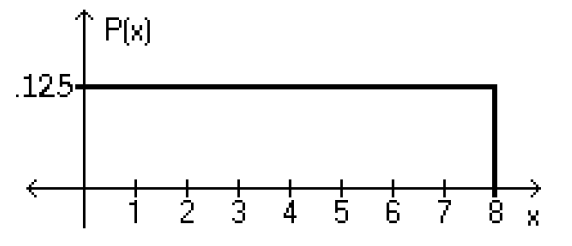
What is the probability that the random variable has a value between 2.6 and 5.4?- 0.2250
- 0.3500
- 0.6000
- 0.4750
- 2.
- Assume that the weight loss for the first month of a diet program varies between 6 pounds and 12 pounds, and is spread evenly over the range of possibilities, so that there is a uniform distribution. Find the probability of the given range of pounds lost.
- 3. Less than 10 pounds
- 5/7
- 1/3
- 2/3
- 1/6
- 3. Less than 10 pounds
- If Z is a standard normal variable, find the probability.
- 4. The probability that Z lies between –0.55 and 0.55
- –0.9000
- –0.4176
- 0.9000
- 0.4176
- 5. P(Z < 0.59)
- 0.7224
- 0.2776
- 0.2190
- 0.2224
- 4. The probability that Z lies between –0.55 and 0.55
- The Precision Scientific Instrument Company manufactures thermometers that are supposed to give readings of 0°C at the freezing point of water. Tests on a large sample of these thermometers reveal that at the freezing point of water, some give readings below 0°C (denoted by negative numbers) and some give readings above 0°C (denoted by positive numbers). Assume that the mean reading is 0°C and the standard deviation of the readings is 1.00°C. Also assume that the frequency distribution of errors closely resembles the normal distribution. A thermometer is randomly selected and tested. Find the temperature reading corresponding to the given information.
- 6. If 9% of the thermometers are rejected because they have readings that are too high, but all other thermometers are acceptable, find the temperature that separates the rejected thermometers from the others.
- 1.45°
- 1.26°
- 1.39°
- 1.34°
- 7. If 6.3% of the thermometers are rejected because they have readings that are too high and another 6.3% are rejected because they have readings that are too low, find the two readings that are cutoff values separating the rejected thermometers from others.
- –1.53°, 1.53°
- –1.45°, 1.45°
- –1.46°, 1.46°
- –1.39°, 1.39°
- 6. If 9% of the thermometers are rejected because they have readings that are too high, but all other thermometers are acceptable, find the temperature that separates the rejected thermometers from the others.
- Assume that X has a normal distribution, and find the indicated probability.
- 8. The mean is μ = 15.2 and the standard deviation is σ = 0.9.
Find the probability that X is greater than 15.2.- 0.0003
- 1.0000
- 0.9998
- 0.5000
- 9. The mean is μ = 22.0 and the standard deviation is σ = 2.4.
Find the probability that X is between 19.7 and 25.3.- 1.0847
- 0.3370
- 0.7477
- 0.4107
- 8. The mean is μ = 15.2 and the standard deviation is σ = 0.9.
- Solve the problem.
- 10. Suppose that replacement times for washing machines are normally distributed with a mean of 8.7 years and a standard deviation of 1.6 years. Find the replacement time that separates the top 18% from the bottom 82%.
- 10.2 years
- 7.2 years
- 9.6 years
- 9.0 years
- 10. Suppose that replacement times for washing machines are normally distributed with a mean of 8.7 years and a standard deviation of 1.6 years. Find the replacement time that separates the top 18% from the bottom 82%.
- Find the indicated probability.
- 11. The volumes of soda in quart soda bottles are normally distributed with a mean of 32.3oz and a standard deviation of 1.2oz. What is the probability that the volume of soda is a randomly selected bottle will be less than 32oz?
- 0.3821
- 0.0987
- 0.5987
- 0.4013
- 11. The volumes of soda in quart soda bottles are normally distributed with a mean of 32.3oz and a standard deviation of 1.2oz. What is the probability that the volume of soda is a randomly selected bottle will be less than 32oz?
- Provide an appropriate response.
- 12. A recent survey based on a random sample of n = 490 voters, predicted that the Independent candidate for the mayoral election will get 23% of the vote, but he actually get 28%. Can it be concluded that the survey was done incorrectly?
Possible answer
- 12. A recent survey based on a random sample of n = 490 voters, predicted that the Independent candidate for the mayoral election will get 23% of the vote, but he actually get 28%. Can it be concluded that the survey was done incorrectly?
- List the different possible samples, and find the mean of each of them.
- 13. The number of books sold over the course of the four-day book fair were 156, 200, 293, and 55. Assume that samples of size 2 are randomly selected with replacement from this population of four values.
Possible answer
- 13. The number of books sold over the course of the four-day book fair were 156, 200, 293, and 55. Assume that samples of size 2 are randomly selected with replacement from this population of four values.
- Solve the problem.
- 14. The weights of the fish in a certain lake are normally distributed with a mean of 15 lb and a standard deviation of 6. If 4 fish are randomly selected, what is the probability that the mean weight will be between 12.6 and 18.6 lb?
- 0.0968
- 0.4032
- 0.6730
- 0.3270
- 15. A study of the amount of time it takes a mechanic to rebuild the transmission for a 1992 Chevrolet Cavalier shows that the mean is 8.4 hours and the standard deviation is 1.8 hours. If 40 mechanics are randomly selected, find the probability that their mean rebuild time exceeds 8.7 hours.
- 0.1469
- 0.1285
- 0.1946
- 0.1346
- 14. The weights of the fish in a certain lake are normally distributed with a mean of 15 lb and a standard deviation of 6. If 4 fish are randomly selected, what is the probability that the mean weight will be between 12.6 and 18.6 lb?
- Use the continuity correction and describe the region of the normal curve that corresponds to the indicated binomial probability.
- 16. The probability of fewer than 56 democrats
- The area to the left of 55.5
- The area to the right of 56.5
- The area to the left of 56
- The area to the left of 56.5
- 16. The probability of fewer than 56 democrats
- For the binomial distribution with the given values for n and p, state whether or not it is suitable to use the normal distribution as an approximation.
- 17. n = 15, p = .5
- Normal approximation is suitable.
- Normal approximation is not suitable.
- 17. n = 15, p = .5
- Estimate the indicated probability by using the normal distribution as an approximation to the binomial distribution.
- 18. A multiple choice test consists of 60 questions. Each question has 4 possible answers of which one is correct. If all answers are random guesses, estimate the probability of getting at least 20% correct.
- 0.0901
- 0.1492
- 0.8508
- 0.3508
- 18. A multiple choice test consists of 60 questions. Each question has 4 possible answers of which one is correct. If all answers are random guesses, estimate the probability of getting at least 20% correct.
- Solve the problem.
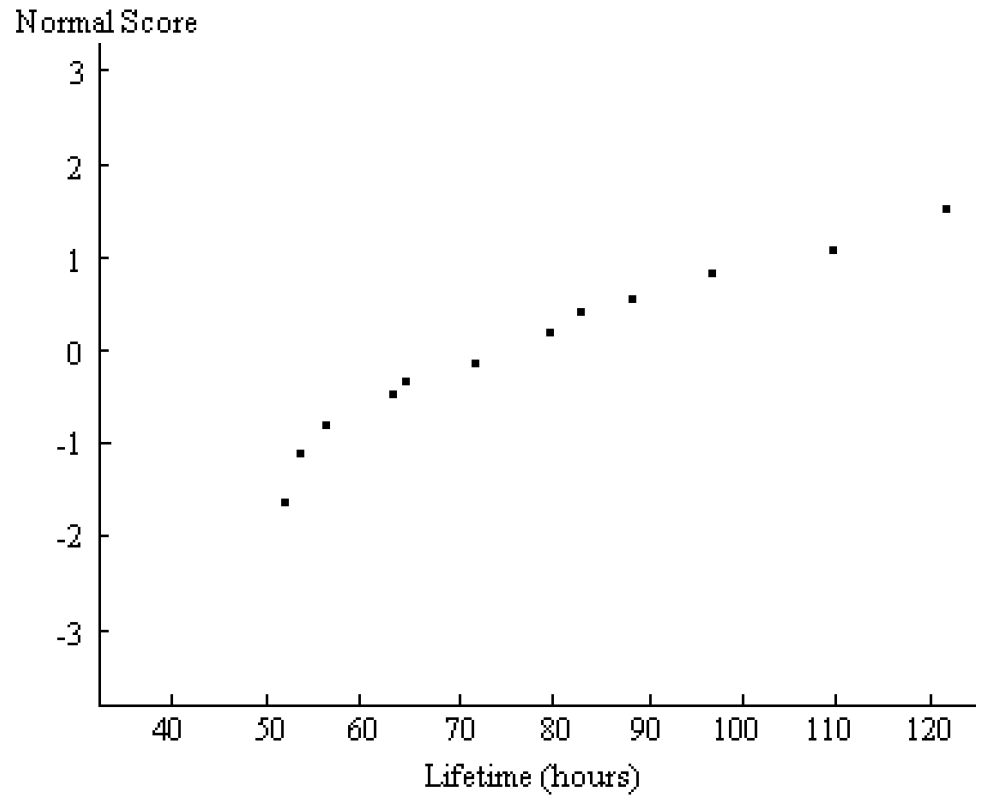
- 19. A normal probability plot is given below for the lifetimes (in hours) of a sample of batteries of a particular brand. Use the plot to assess the normality of the lifetimes of these batteries. Explain your reasoning.
Possible answer
- 19. A normal probability plot is given below for the lifetimes (in hours) of a sample of batteries of a particular brand. Use the plot to assess the normality of the lifetimes of these batteries. Explain your reasoning.
- Examine the given data set and determine whether the requirement of a normal distribution is satisfied. Assume that the requirement for a normal distribution is loose in the sense that the population distribution need not be exactly normal, but it must have a distribution which is basically symmetric with only one mode. Explain why you do or do not think that the requirement is satisfied.
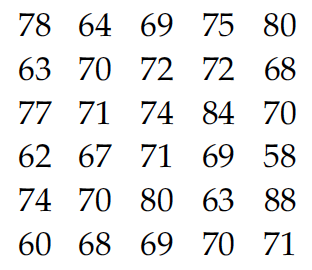
- 20. The heart rates (in beats per minute) of 30 randomly selected students are given below.
Possible answer
- 20. The heart rates (in beats per minute) of 30 randomly selected students are given below.
© 2020 DrillPal.com