Dec 1, 2016
- Provide an appropriate response.
- 1. Describe at least two advantages to using stemplots rather than frequency distribution.
Possible answer - 2. Suppose that a data set has a minimum value of 18 and a max of 83 and that you want 5 classes. Explain how to find the class width for this frequency table. What happens if you mistakenly use a class width of 13 instead of 14?
Possible answer
- 1. Describe at least two advantages to using stemplots rather than frequency distribution.
- Solve the problem.
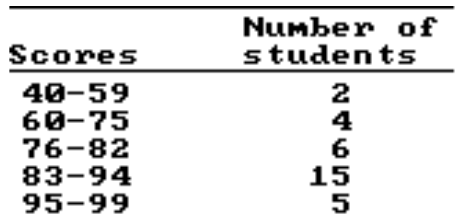
- 3. The following frequency distribution analyzes the scores on a math test. Find the class boundaries of scores interval 95-99.
- 95.5, 99.5
- 95.5, 100.5
- 94.5, 100.5
- 94.5, 99.5
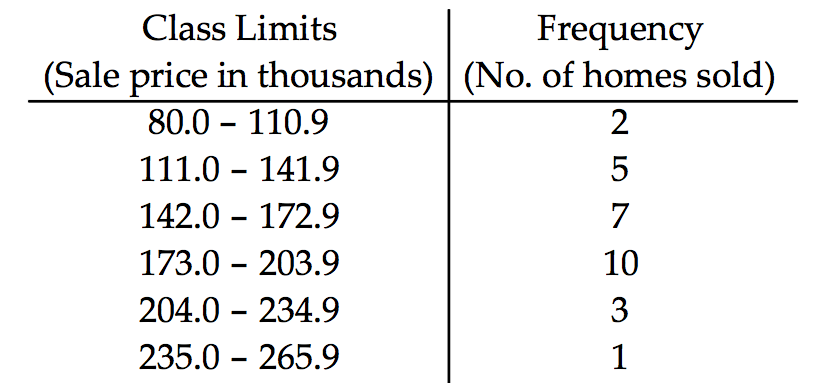
- 4. Using the information in the table on home sale prices in the city of Summerhill for the month of June, determine the width of each class.
- 28
- 31
- 30
- 61
- 3. The following frequency distribution analyzes the scores on a math test. Find the class boundaries of scores interval 95-99.
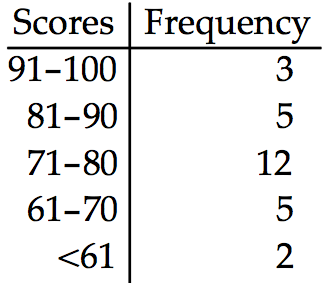
- Construct the relative frequency distribution that corresponds to the given frequency distribution.
- 5.
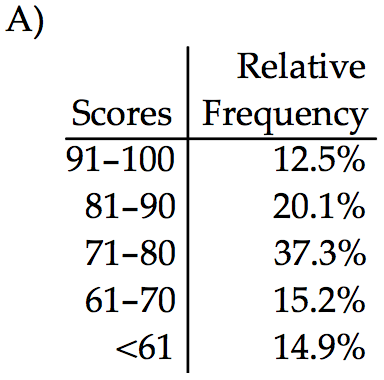
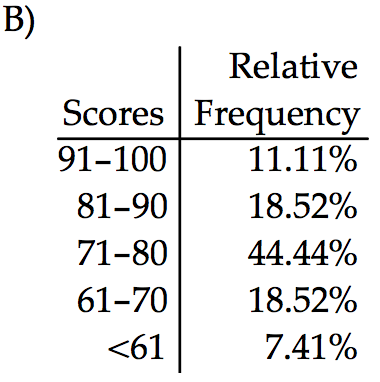
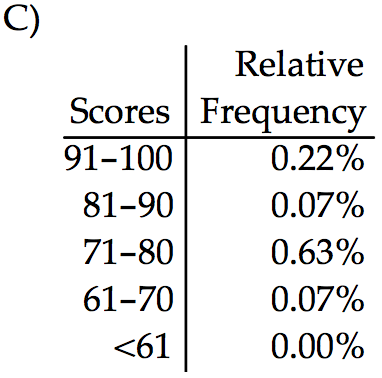
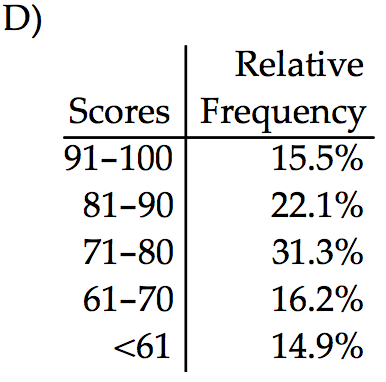
- the relative frequency distribution C
- the relative frequency distribution A
- the relative frequency distribution D
- the relative frequency distribution B
- 5.
- Solve the problem.
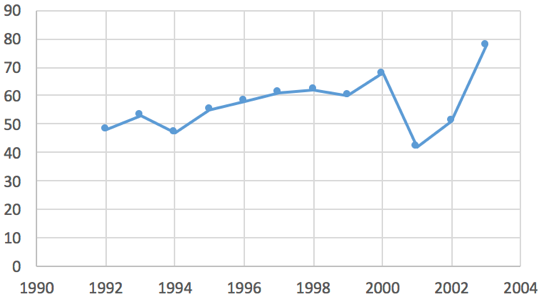
- 6. Use the high closing values of Naristar Inc. stock from the years 1992 – 2003 to construct a time-series graph. (Let x = 0 stand for 1992 and so on…) Identify a trend.
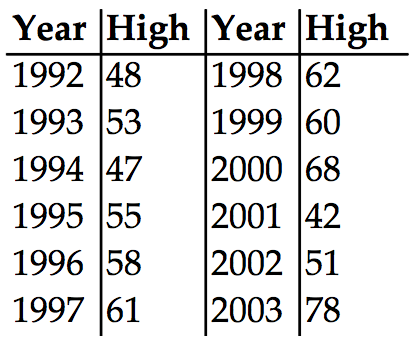
- Possible answer
- 6. Use the high closing values of Naristar Inc. stock from the years 1992 – 2003 to construct a time-series graph. (Let x = 0 stand for 1992 and so on…) Identify a trend.
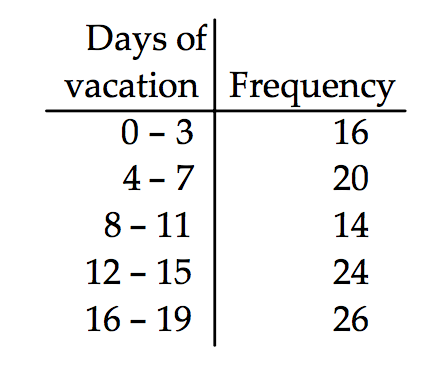
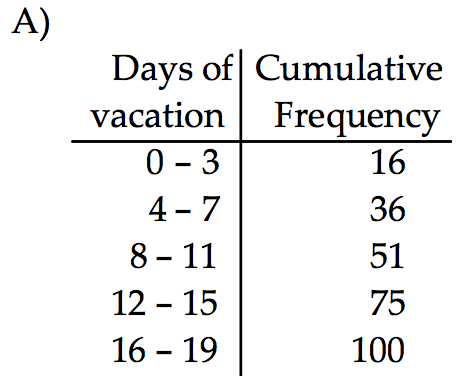
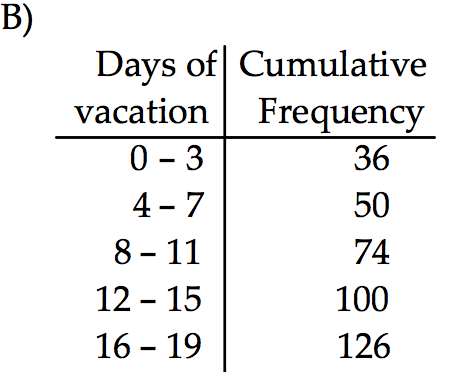
- Construct the cumulative frequency distribution that corresponds to the given frequency distribution.
- 7.
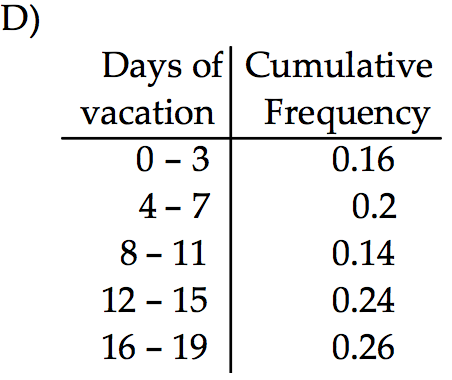
- the cumulative frequency distribution D
- the cumulative frequency distribution C
- the cumulative frequency distribution A
- the cumulative frequency distribution B
- 7.
- Provide an appropriate response.
- 8. Sturges’ guideline suggests that when constructing a frequency distribution, the ideal number of classes can be approximated by 1+(log n)/(log 2), where n is the number of data values. Use this guideline to find the ideal number of classes when the number of data values is 100. Round your answer to the nearest whole number.
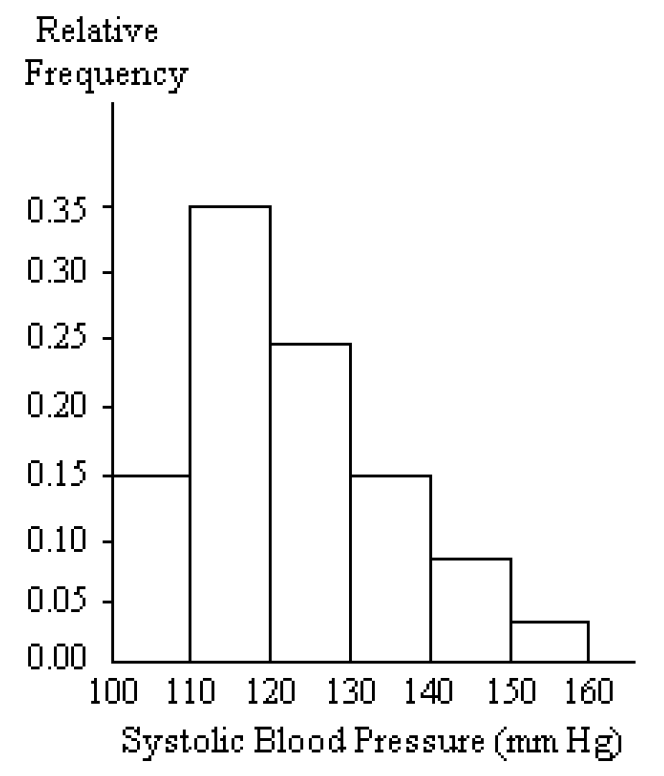
A nurse measured the blood pressure of each person who visited her clinic. Following is a relative-frequency histogram for the systolic blood pressure readings for those people aged between 25 and 40. Use the histogram to answer the question. The blood pressure readings were given to the nearest whole number.
- 6
- 7
- 9
- 8
- 9. Approximately what percentage of the people aged 25–40 had a systolic blood pressure reading between 110 and 139 inclusive?
- 74%
- 59%
- 39%
- 89%
- 8. Sturges’ guideline suggests that when constructing a frequency distribution, the ideal number of classes can be approximated by 1+(log n)/(log 2), where n is the number of data values. Use this guideline to find the ideal number of classes when the number of data values is 100. Round your answer to the nearest whole number.
- Provide and appropriate response.
- 10. Construct a frequency distribution and the corresponding histogram in which the following conditions are satisfied:
-The frequency for the second class is twice the frequency of the first class.
-In the histogram, the area of the bar corresponding to the second class is four times the area of the bar corresponding to the first class.
What do you know about the width of the second class in relation to that of the first class? - Possible answer
- 10. Construct a frequency distribution and the corresponding histogram in which the following conditions are satisfied:
- Use the pie chart to solve the problem.
- 11. A survey of the 9225 vehicles on the campus of State University yielded the following circle graph.
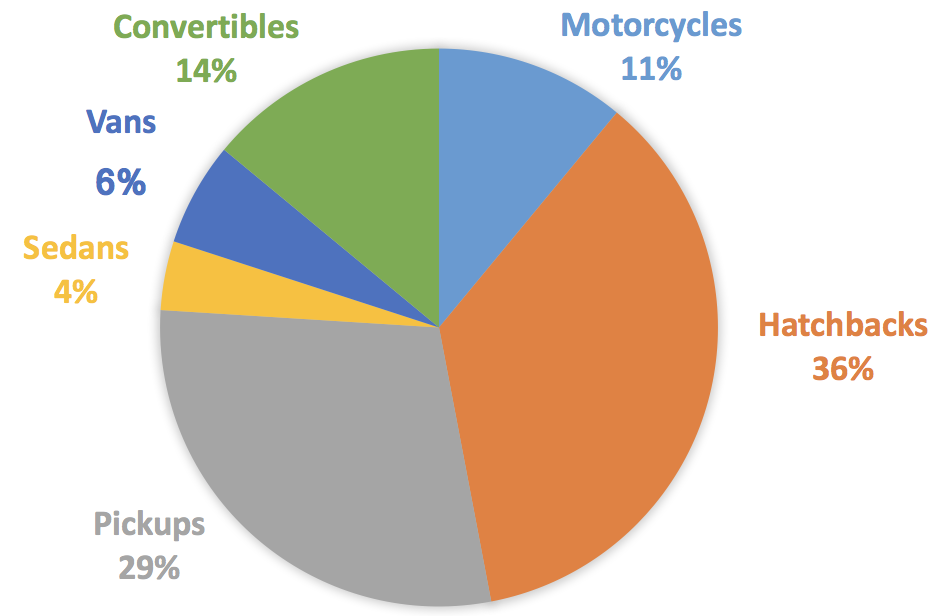
- Find the number of vans. Round your result to the nearest whole number.
- 304
- 363
- 3625
- 3632
- 12. The pie chart below gives the inventory of the men’s department of a store.
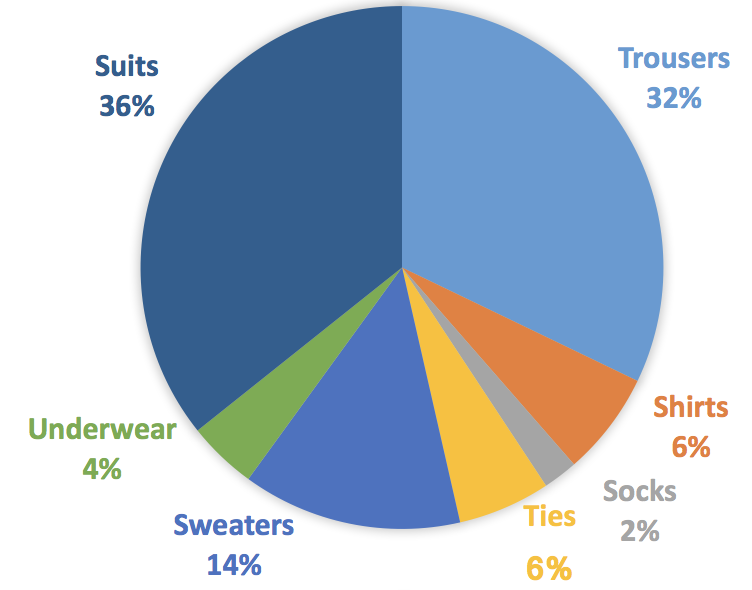
- What is the total inventory?
- $58,820
- $58,720
- $57,820
- $57,720
- 11. A survey of the 9225 vehicles on the campus of State University yielded the following circle graph.
- Find the original data from the stem-and-leaf plot.
- 13.
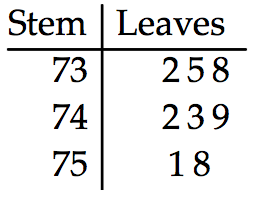
- 732, 735, 738, 742, 743, 749, 751, 758
- 75, 78, 81, 76, 77, 83, 76, 83
- 73258, 74239, 7518
- 732, 735, 748, 742, 743, 749, 751, 768
- 14.
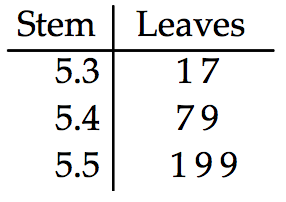
- 0.63, 1.23, 1.24, 1.44, 0.65, 1.45, 1.45
- 5.31, 5.32, 5.47, 5.49, 5.53, 5.59, 5.59
- 0.63, 0.63, 1.24, 1.24, 0.65, 1.45, 1.46
- 5.31, 5.37, 5.47, 5.49, 5.51, 5.59, 5.59
- 13.
- Construct the dot plot for the given data.
- 15. A store manager counts the number of customers who make a purchase in his store each day. The data are as follows:
10 11 8 14 7 10 10 11 8 7
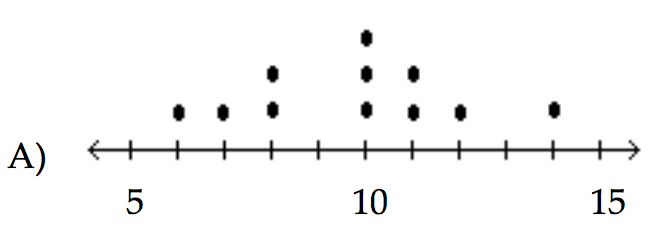
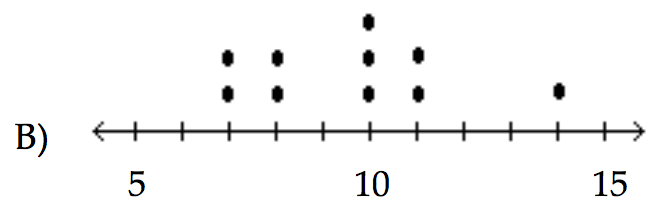
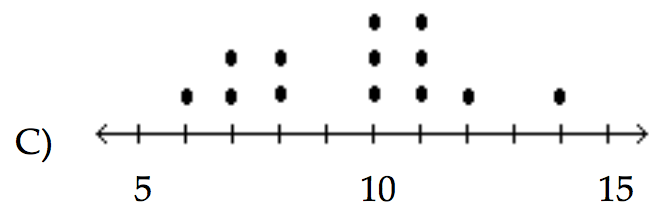
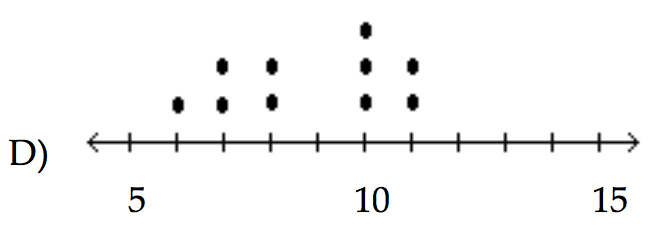
- the dot plot B
- the dot plot A
- the dot plot C
- the dot plot D
- 15. A store manager counts the number of customers who make a purchase in his store each day. The data are as follows:
- Use the data to create a stemplot.
- 16. The attendance counts for this season’s basketball games are listed below.
227 239 215 219
221 233 229 233
235 228 245 231
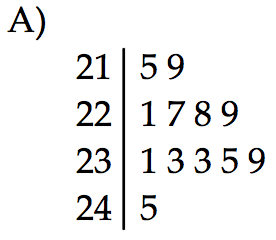
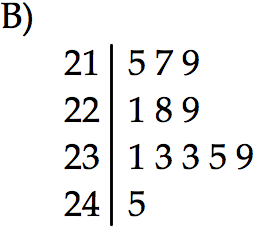
- the stemplot B
- the stemplot A
- 16. The attendance counts for this season’s basketball games are listed below.
- Use the given paired data to construct a scatterplot.
- 17. The normal monthly precipitation (in inches) for August is listed for 39 different U.S. cities. Construct an expanded stemplot with about 9 rows.
3.5 1.6 2.4 3.7 4.1 3.9 1.0 3.6 1.7 0.4 3.2 4.2 4.1
4.2 3.4 3.7 2.2 1.5 4.2 3.4 2.7 4.0 2.0 0.8 3.6 3.7
0.4 3.7 2.0 3.6 3.8 1.2 4.0 3.1 0.5 3.9 0.1 3.5 3.4
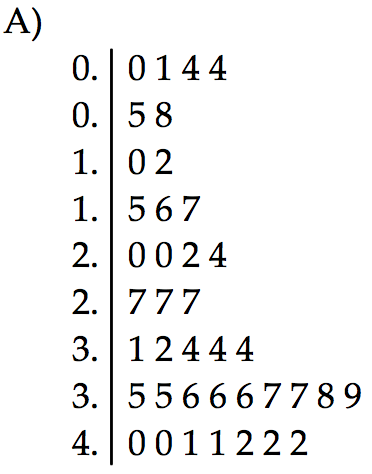
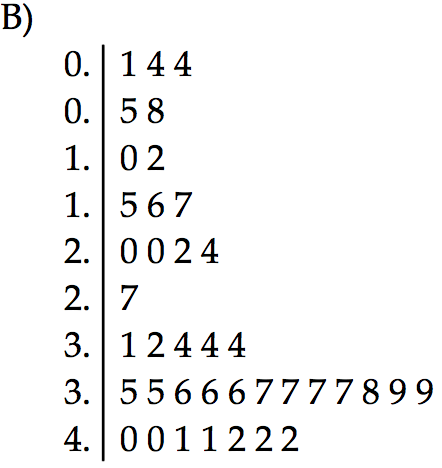
- the stemplot B
- the stemplot A
- 17. The normal monthly precipitation (in inches) for August is listed for 39 different U.S. cities. Construct an expanded stemplot with about 9 rows.
- Construct a pie chart representing the given data set.
- 18. After reviewing a movie, 900 people rated the movie as excellent, good, or fair. The following data give the rating distribution.
Excellent — 180
Good — 450
Fair — 270
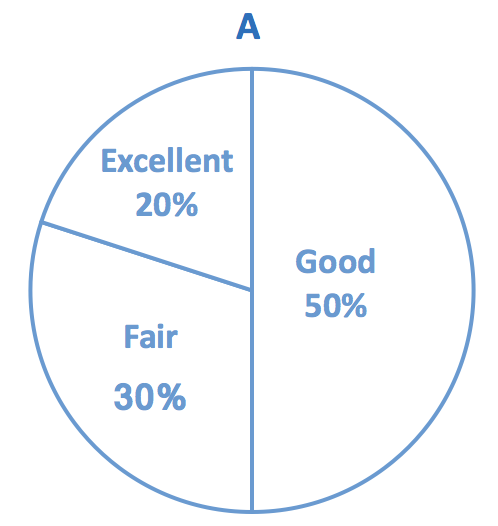
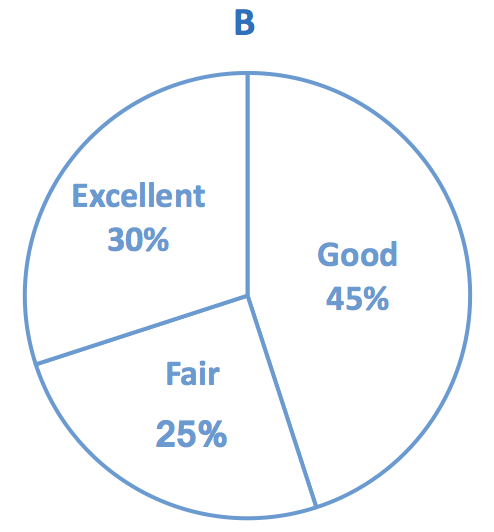
- the pie chart A
- the pie chart B
- 18. After reviewing a movie, 900 people rated the movie as excellent, good, or fair. The following data give the rating distribution.
- Solve the problem.
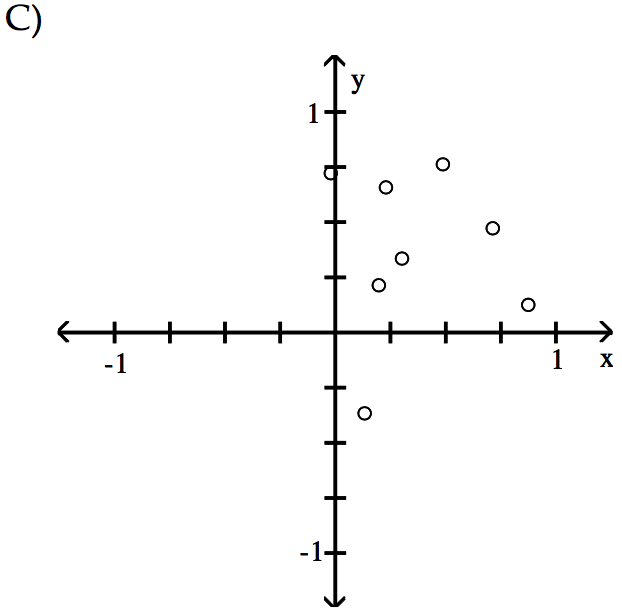
- 19. At the National Criminologists Association’s annual convention, participants filled out a questionnaire asking what they thought was the most important cause for criminal behavior. The tally was as follows:
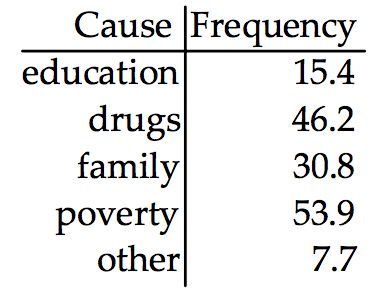
- Which of the Pareto carts is displays these findings?
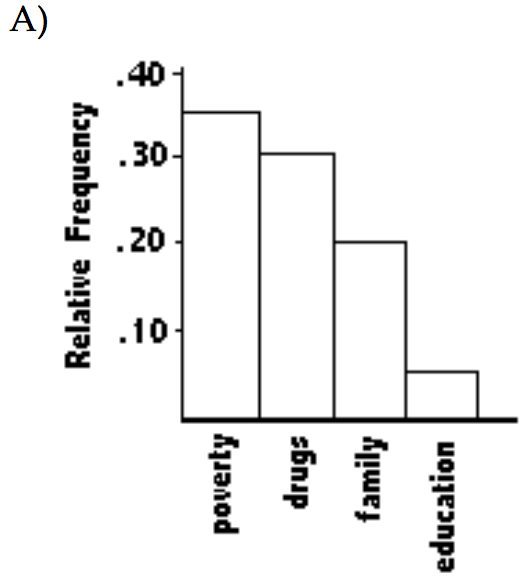
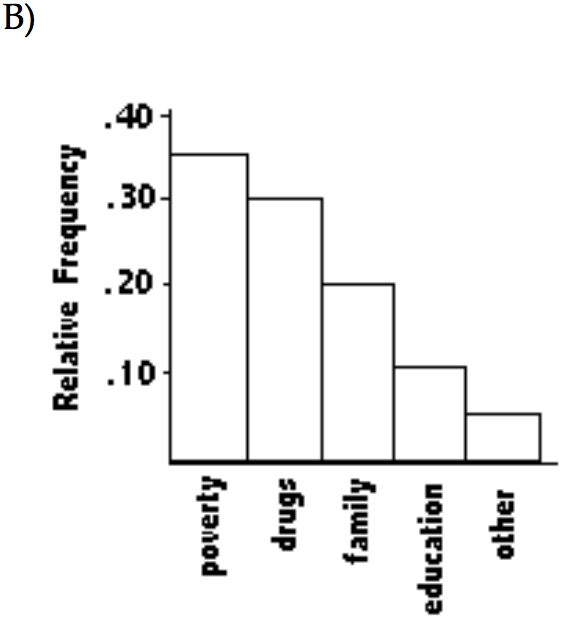
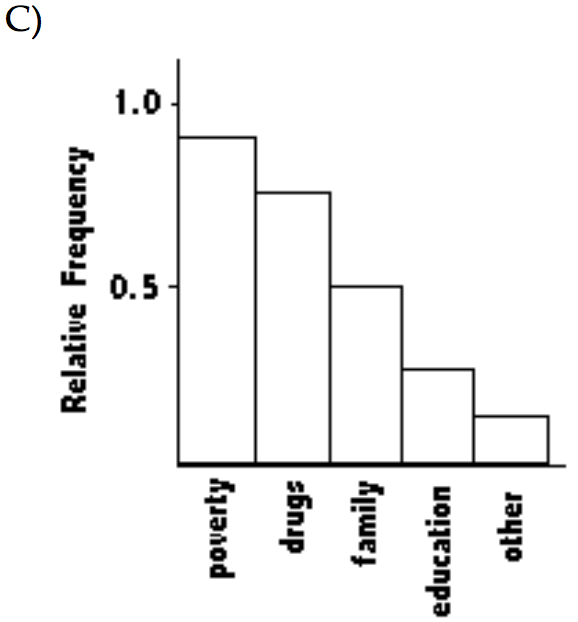
- the Pareto chart B
- the Pareto chart A
- the Pareto chart C
- the Pareto chart D
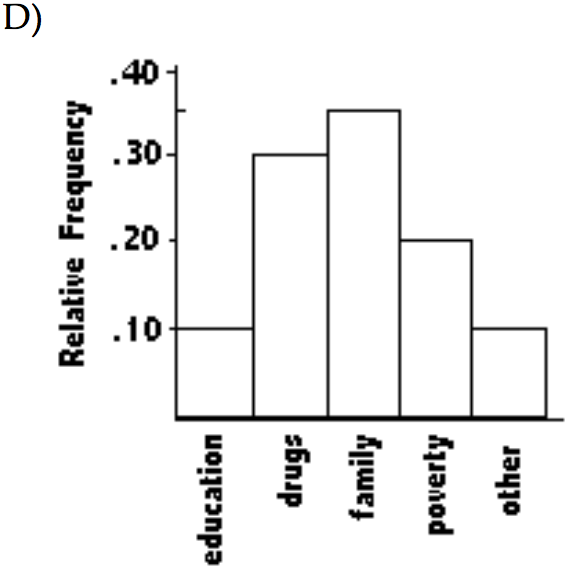
- 20. Use the given paired data to construct a scatterplot.
x 0.31 0.88 0.49 0.23 0.14 0.72 -0.02 0.2
y 0.33 0.12 0.76 0.65 -0.37 0.47 0.72 0.21
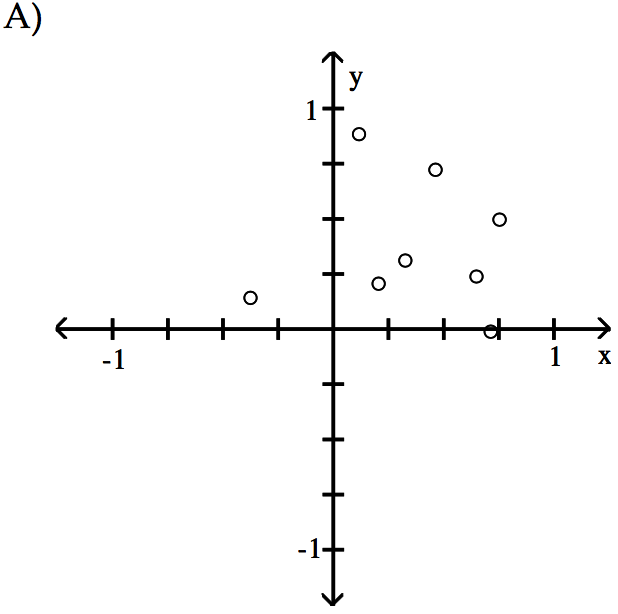
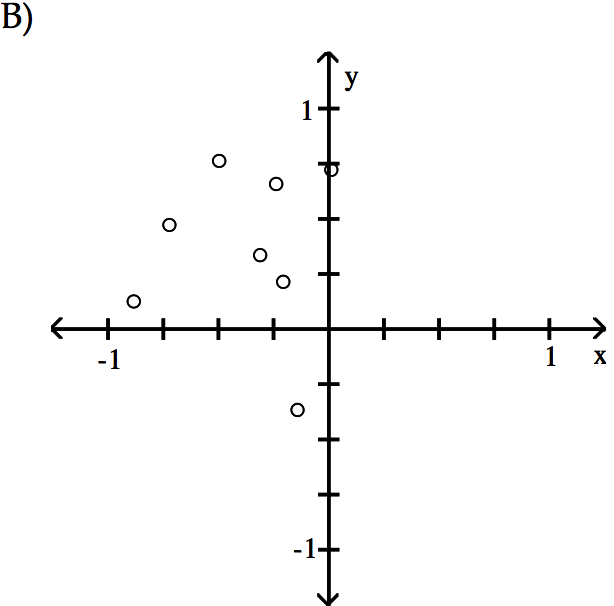
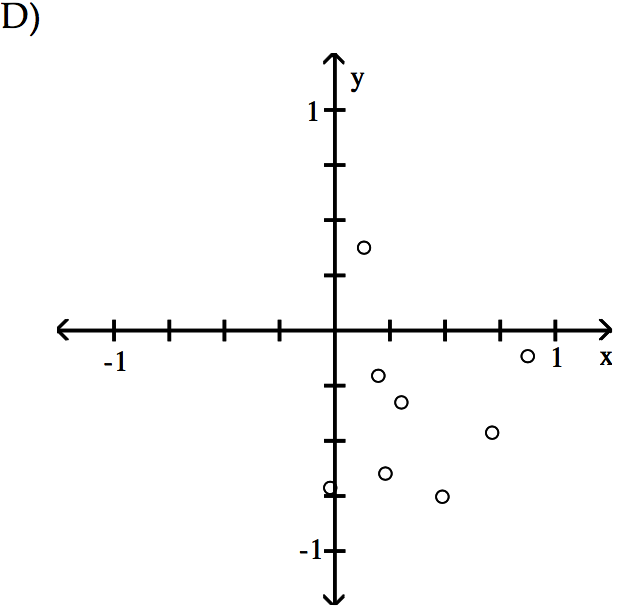
- the scatterplot B
- the scatterplot D
- the scatterplot C
- the scatterplot A
- 19. At the National Criminologists Association’s annual convention, participants filled out a questionnaire asking what they thought was the most important cause for criminal behavior. The tally was as follows:
© 2020 DrillPal.com