Dec 8, 2016
- Provide an appropriate response.
- 1. The mean of a data set is . . . one of the data points in a set of data. Explain your answer by giving at least one example.
- never
- sometimes
- always
- never
- Possible answer
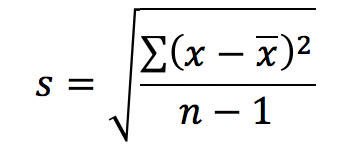
- 2. Without calculating the standard deviation, compare the standard deviation for the following data sets. (Note: All data sets have a mean of 30.) Which do you expect to have the largest standard deviation and which do you expect to have the smallest standard deviation? Explain your answers in terms of the formula:
30, 30, 30, 30, 30, 30, 30, 30, 30, 30
20, 25, 25, 30, 30, 30, 30, 35, 35, 40
20, 20, 20, 25, 25, 35, 35, 40, 40, 40
Possible answer - 3. Marla scored 85% on her last unit exam in her statistics class. When Marla took the SAT exam, she scored at the 85 percentile in mathematics. Explain the difference in these two scores.
Possible answer - 4. The normal monthly precipitation (in inches) for August is listed for 20 different U.S. cities. Find the mean of the data.
3.5 1.6 2.4 3.7 4.1
3.9 1.0 3.6 4.2 3.4
3.7 2.2 1.5 4.2 3.4
2.7 0.4 3.7 2.0 3.6- 3.27 in.
- 2.8 in.
- 2.94 in.
- 3.09 in.
- 1. The mean of a data set is . . . one of the data points in a set of data. Explain your answer by giving at least one example.
- Find the median for the given sample data.
- 5. The distances traveled (in miles) to 7 different swim meets are given below:
12, 18, 31, 46, 69, 71, 85
Find the median distance traveled.- 46 miles
- 69 miles
- 47 miles
- 31 miles
- 5. The distances traveled (in miles) to 7 different swim meets are given below:
- Find the mode(s) for the given sample data.
- 6. The weights (in ounces) of 14 different apples are shown below:
6.8 5.9 5.7 6.5 5.4 6.8 5.9
4.9 4.8 6.5 6.8 4.9 6.5 4.7- 6.8, 6.5
- 6.8
- 6.5
- None
- 6. The weights (in ounces) of 14 different apples are shown below:
- Find the midrange for the given sample data.
- 7. Bill kept track of the number of hours he spent exercising each week. The results for 15 weeks are shown below. Find the midrange.
7.2 6.5 7.2 7.2 7.9
8.0 6.5 8.2 8.5 7.2
8.7 6.5 8.0 8.9 7.9- 7.9
- 7.6
- 7.7
- 2.4
- 8. The heights of a group of professional basketball players are summarized in the frequency distribution below. Find the mean height. Round your answer to one decimal place.
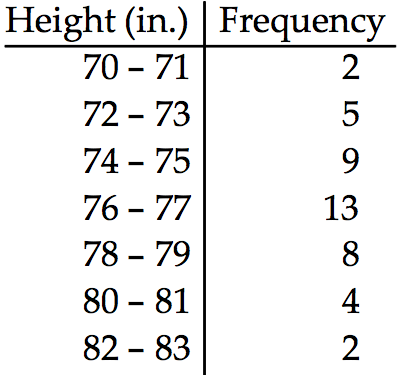
- 76.4 in.
- 73.5 in
- 78.2 in.
- 74.6 in.
- 7. Bill kept track of the number of hours he spent exercising each week. The results for 15 weeks are shown below. Find the midrange.
- Solve the problem.
- 9. Elaine gets quiz grades of 67, 64, and 87. She gets a 84 on her final exam. Find the weighted mean if the quizzes each count for 15% and the final exam counts for 55% of the final grade.
- 78.9
- 72.1
- 78.3
- 75.5
- 10. The mean salary of the female employees of one company is $29,525. The mean salary of the male employees of the same company is $33,470. Can the mean salary of all employees of the company be obtained by finding the mean of $29,525 and $ 33,470?
Explain your thinking. Under what conditions would the mean of $29,525 and $33,470 yield the mean salary of all employees of the company?
Possible answer
- 9. Elaine gets quiz grades of 67, 64, and 87. She gets a 84 on her final exam. Find the weighted mean if the quizzes each count for 15% and the final exam counts for 55% of the final grade.
- Find the range for the given data.
- 11. The manager of an electrical supply store measured the diameters of the rolls of wire in the inventory. The diameters of the rolls (in m) are listed below.
0.165 0.114 0.503 0.392 0.579 0.311
Compute the range.- 0.144
- 0.503
- 0.146
- 0.465
- 12. Find the variance for these data. Round your answer to one more decimal place than the original data.
5.0 8.0 4.9 6.8 2.8- 10.26
- 3.96
- 3.17
- 3.86
- 11. The manager of an electrical supply store measured the diameters of the rolls of wire in the inventory. The diameters of the rolls (in m) are listed below.
- Solve the problem.
- 13. A distribution of data has a maximum value of 74, a median value of 58, and a minimum of 42. Use the range rule of thumb to find the standard deviation. Round results to the nearest tenth.
- 4.3
- 6.4
- 16.0
- 8.0
- 14. F company performs quality control on its juice bottles. It finds that the volumes of juice in its 16 ounce bottles have a mean of 16.3 ounces and a standard deviation of 0.09 ounces. Use the range rule of thumb to estimate the minimum and maximum “usual” volumes.
- 16.21 ounces, 16.39 ounces
- 16.12 ounces, 16.48 ounces
- 16.03 ounces, 16.57 ounces
- 16.07 ounces, 16.17 ounces
- 13. A distribution of data has a maximum value of 74, a median value of 58, and a minimum of 42. Use the range rule of thumb to find the standard deviation. Round results to the nearest tenth.
- Use the empirical rule to solve the problem.
- 15. The amount of Jen’s monthly phone bill is normally distributed with a mean of $75 and a standard deviation of $9. What percentage of her phone bills are between $48 and $102?
- 99.74%
- 99.99%
- 68.26%
- 95.44%
- 15. The amount of Jen’s monthly phone bill is normally distributed with a mean of $75 and a standard deviation of $9. What percentage of her phone bills are between $48 and $102?
- Find the z-score corresponding to the given value and use the z-score to determine whether the value is unusual. Consider a score to be unusual if its z-score is less than -2.00 or greater than 2.00. Round the z-score to the nearest tenth if necessary.
- 16. A time for the 100-meter sprint of 15.0 seconds at a school where the mean time for the 100-meter sprint is 17.5 seconds and the standard deviation is 2.1 seconds.
- –2.5; unusual
- –1.2; unusual
- –1.2; not unusual
- 1.2; not unusual
- 16. A time for the 100-meter sprint of 15.0 seconds at a school where the mean time for the 100-meter sprint is 17.5 seconds and the standard deviation is 2.1 seconds.
- Determine which score corresponds to the higher relative position.
- 17. Which is better, a score of 92 on a test with a mean of 71 and a standard deviation of 15, or a score of 688 on a test with a mean of 492 and a standard deviation of 150?
- Both scores have the same relative position.
- a score of 92
- a score of 688
- 17. Which is better, a score of 92 on a test with a mean of 71 and a standard deviation of 15, or a score of 688 on a test with a mean of 492 and a standard deviation of 150?
- Find the percentile for the data point.
- 18. Data set:
51 36 48 75 75 75 49;
data point 51.- 20
- 57
- 50
- 43
- 18. Data set:
- Provide an appropriate response.
- 19. If all the values in a data set are converted to z-scores, the shape of the distribution of the z-scores will be the same as the distribution of the original data. True or false?
- True
- False
- 19. If all the values in a data set are converted to z-scores, the shape of the distribution of the z-scores will be the same as the distribution of the original data. True or false?
- Construct a boxplot for the given data. Include values of the 5-number summary in all boxplots.
- 20. The test scores of 40 students are listed below. Construct a boxplot for the data set:
25 35 43 44 47 48 54 55 56 57
59 62 63 65 66 68 69 69 71 72
72 73 74 76 77 77 78 79 80 81
81 82 83 85 89 92 93 94 97 98
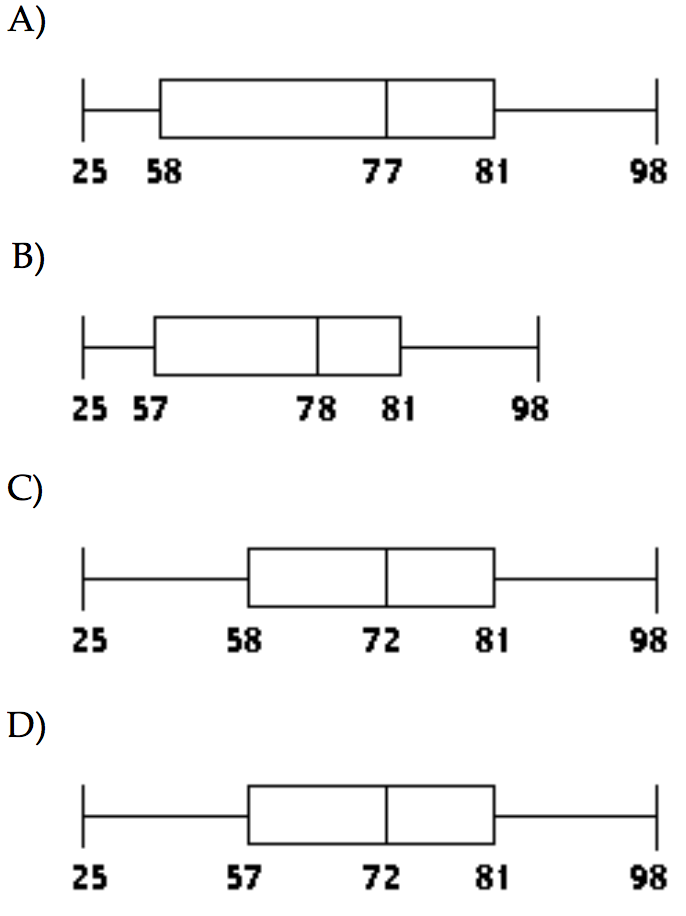
- the boxplot C
- the boxplot B
- the boxplot A
- the boxplot D
- 20. The test scores of 40 students are listed below. Construct a boxplot for the data set:
© 2020 DrillPal.com