Jan 12, 2017
- Provide an appropriate response.
- 1. The typical computer random-number generator yields numbers in a uniform distribution between 0 and 1 with a mean of 0.500 and standard deviation of 0.289.
(a) Suppose a sample of size 50 is randomly generated. Find the probability that the mean is below 0.300.
(b) Suppose a sample size of 15 is randomly generated. Find the probability that the mean is below 0.300. These two problems appear to be very similar. Only one can be solved by the Central Limit theorem. Which one and why?
Possible answer
- 1. The typical computer random-number generator yields numbers in a uniform distribution between 0 and 1 with a mean of 0.500 and standard deviation of 0.289.
- Using the following uniform density curve, answer the question.
- 2.
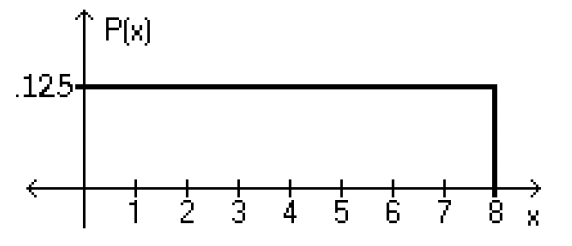
What is the probability that the random variable has a value between 0.4 and 0.7?- 0.038
- 0.088
- 0.288
- 0.163
- 2.
- Solve the problem.
- 3. Assume that the weight loss for the first month of a diet program varies between 6 pounds and 12 pounds, and is spread evenly over the range of possibilities, so that there is a uniform distribution. Find the probability of the given range of pounds lost — more than 10 pounds.
- 1/7
- 2/3
- 5/6
- 1/3
- 3. Assume that the weight loss for the first month of a diet program varies between 6 pounds and 12 pounds, and is spread evenly over the range of possibilities, so that there is a uniform distribution. Find the probability of the given range of pounds lost — more than 10 pounds.
- If Z is a standard normal variable, find the probability.
- 4. The probability that Z is greater than –1.82.
- 0.4656
- –0.0344
- 0.9656
- 0.0344
- 5. P(–0.73 < Z < 2.27)
- 0.4884
- 0.7557
- 1.54
- 0.2211
- 4. The probability that Z is greater than –1.82.
- The Precision Scientific Instrument Company manufactures thermometers that are supposed to give readings of 0°C at the freezing point of water. Tests on a large sample of these thermometers reveal that at the freezing point of water, some give readings below 0°C (denoted by negative numbers) and some give readings above 0°C (denoted by positive numbers). Assume that the mean reading is 0°C and the standard deviation of the readings is 1.00°C. Also assume that the frequency distribution of errors closely resembles the normal distribution. A thermometer is randomly selected and tested. Find the temperature reading corresponding to the given information.
- 6. If 7% of the thermometers are rejected because they have readings that are too low, but all other thermometers are acceptable, find the temperature that separates the rejected thermometers from the others.
- –1.26
- –1.39
- –1.48
- –1.53
- 7. A quality control analyst wants to examine thermometers that give readings in the bottom 4%. Find the reading that separates the bottom 4% form the others.
- –1.89
- –1.75
- –1.63
- –1.48
- 8. The mean is μ = 60.0 and the standard deviation is σ = 4.0.
Find the probability that X is less than 53.0.- 0.0802
- 0.9599
- 0.0401
- 0.5589
- 9. The mean is μ = 137.0 and the standard deviation is σ = 5.3.
Find the probability that X is between 134.4 and 140.1.- 0.4069
- 1.0311
- 0.8138
- 0.6242
- 6. If 7% of the thermometers are rejected because they have readings that are too low, but all other thermometers are acceptable, find the temperature that separates the rejected thermometers from the others.
- Solve the problem.
- 10. Assume that women have heights that are normally distributed with a mean of 63.6 inches and a standard deviation of 2.5 inches. Find the value of the quartile Q3.
- 65.3 inches
- 64.3 inches
- 66.1 inches
- 67.8 inches
- 10. Assume that women have heights that are normally distributed with a mean of 63.6 inches and a standard deviation of 2.5 inches. Find the value of the quartile Q3.
- Find the indicated probability.
- 11. The diameters of pencils produces by a certain machine are normally distributed with a mean of 0.30 inches and a standard deviation of 0.01 inches. What is the probability that the diameter of a randomly selected pencil will be less than 0.285 inches?
- 0.9332
- 0.0668
- 0.4332
- 0.0596
- 11. The diameters of pencils produces by a certain machine are normally distributed with a mean of 0.30 inches and a standard deviation of 0.01 inches. What is the probability that the diameter of a randomly selected pencil will be less than 0.285 inches?
- Solve the problem.
- 12. A bank’s loan officer rates applicants for credit. The ratings are normally distributed with a mean of 200 and a standard deviation of 50. If 40 different applicants are randomly selected, find the probability that their mean is above 215.
- 0.1179
- 0.0287
- 0.3821
- 0.4713
- 12. A bank’s loan officer rates applicants for credit. The ratings are normally distributed with a mean of 200 and a standard deviation of 50. If 40 different applicants are randomly selected, find the probability that their mean is above 215.
- Provide an appropriate response.
- 13. A poll of 1100 randomly selected students in grades 6 through 8 was conducted and found that 47% enjoy playing sports. Would confidence in the results increase if the sample size were 3600 instead of 1100? Why or why not?
Possible answer
- 13. A poll of 1100 randomly selected students in grades 6 through 8 was conducted and found that 47% enjoy playing sports. Would confidence in the results increase if the sample size were 3600 instead of 1100? Why or why not?
- List the different possible samples, and find the mean of each of them.
- 14. Personal phone calls received in the last three days by a new employee were 3, 5, and 6. Assume that samples of size 2 are randomly selected with replacement from this population of three values.
Possible answer
- 14. Personal phone calls received in the last three days by a new employee were 3, 5, and 6. Assume that samples of size 2 are randomly selected with replacement from this population of three values.
- Solve the problem.
- 15. A study of the amount of time it takes a mechanic to rebuild the transmission for a 1992 Chevrolet Cavalier shows that the mean is 8.4 hours and the standard deviation is 1.8 hours. If 40 mechanics are randomly selected, find the probability that their mean rebuild time exceeds 9.1 hours.
- 0.0046
- 0.1285
- 0.0069
- 0.1046
- 15. A study of the amount of time it takes a mechanic to rebuild the transmission for a 1992 Chevrolet Cavalier shows that the mean is 8.4 hours and the standard deviation is 1.8 hours. If 40 mechanics are randomly selected, find the probability that their mean rebuild time exceeds 9.1 hours.
- Use the continuity correction and describe the region of the normal curve that corresponds to the indicated binomial probability.
- 16. The probability of no more than 51 defective CD’s
- The area to the left of 50.5
- The area to the left of 51.5
- The area to the right of 51.5
- The area to the left of 51
- 16. The probability of no more than 51 defective CD’s
- For the binomial distribution with the given values for n and p, state whether or not it is suitable to use the normal distribution as an approximation.
- 17. n = 47, p = .9
- Normal approximation is not suitable.
- Normal approximation is suitable.
- 17. n = 47, p = .9
- Estimate the indicated probability by using the normal distribution as an approximation to the binomial distribution.
- 18. Two percent of hair dryers produced in a certain plant are defective. Estimate the probability that of 10,000 randomly selected hair dryers, at least 219 are defective.
- 0.9066
- 0.0869
- 0.0934
- 0.0823
- 18. Two percent of hair dryers produced in a certain plant are defective. Estimate the probability that of 10,000 randomly selected hair dryers, at least 219 are defective.
- Solve the problem.
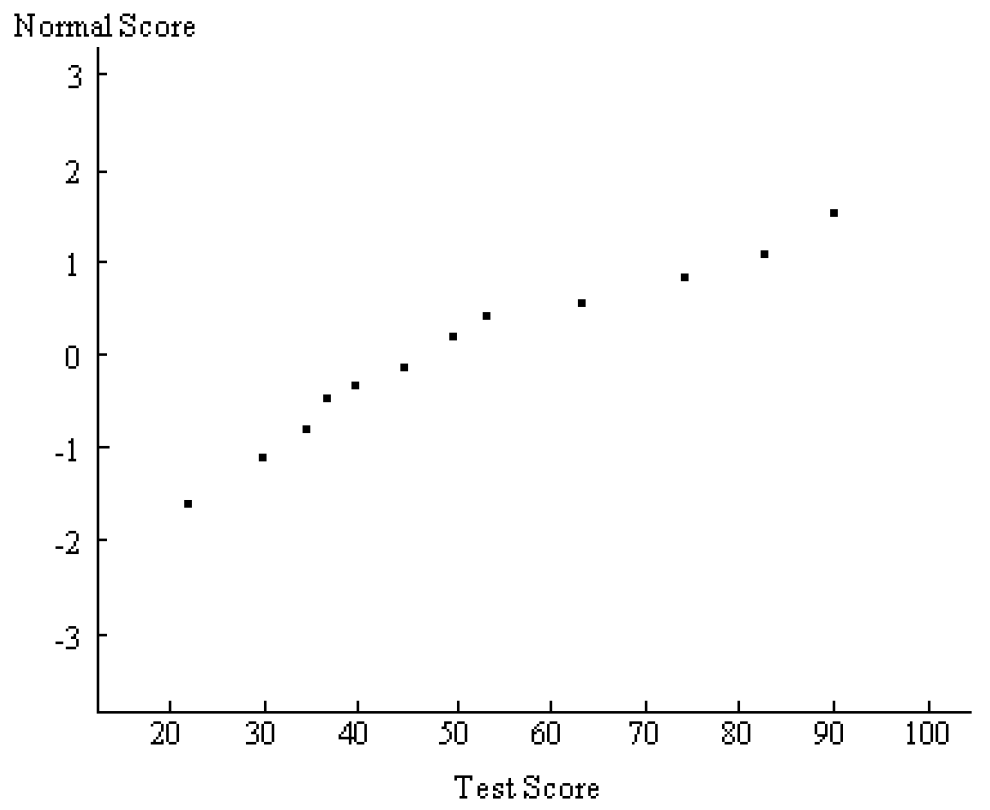
- 19. A normal probability plot is given below for a sample of scores on an aptitude test. Use the plot to assess the normality of scores on this test. Explain your reasoning.
Possible answer
- 19. A normal probability plot is given below for a sample of scores on an aptitude test. Use the plot to assess the normality of scores on this test. Explain your reasoning.
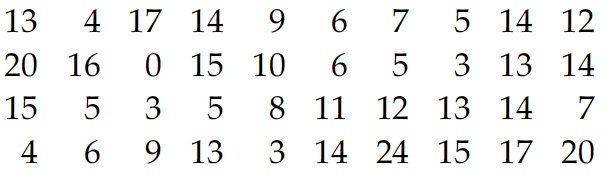
- Examine the given data set and determine whether the requirement of a normal distribution is satisfied. Assume that the requirement for a normal distribution is loose in the sense that the population distribution need not be exactly normal, but it must have a distribution which is basically symmetric with only one mode. Explain why you do or do not think that the requirement is satisfied.
- 20. The data below represents the amount of television watched per week (in hours) for 40 randomly selected teenagers.
Possible answer
- 20. The data below represents the amount of television watched per week (in hours) for 40 randomly selected teenagers.
© 2020 DrillPal.com